

Image Details
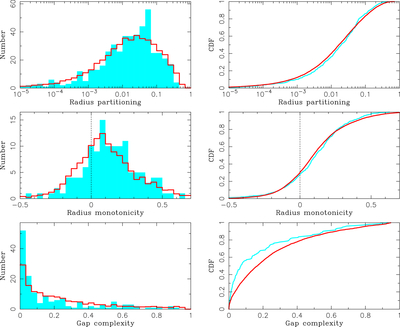
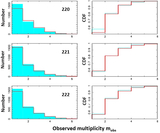
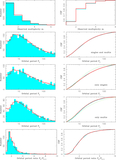
Caption: Figure 4.
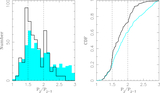
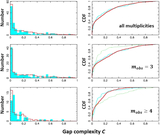
The marginalized best-fit ﹩{{ \mathcal M }}_{{\rm{obs}}}﹩ from the ﹩{{ \mathcal M }}_{219}﹩ model (red lines) is compared to the marginalized ﹩{{ \mathcal D }}_{{\rm{kep}}}﹩ (blue histograms and blue lines). The two columns of plots show the differential (left) and cumulative distribution functions (right). From top to bottom, the rows of plots show: the (1) radius partitioning (QR), (2) radius monotonicity (MR), and (3) gap complexity (﹩{ \mathcal C }﹩) (G. J. Gilbert & D. C. Fabrycky 2020; M. Y. He et al. 2020).
Other Images in This Article
Show More
Copyright and Terms & Conditions
© 2026. The Author(s). Published by the American Astronomical Society.

Copyright ©
2026 Astronomy Image Explorer. All Rights Reserved.
