

Image Details
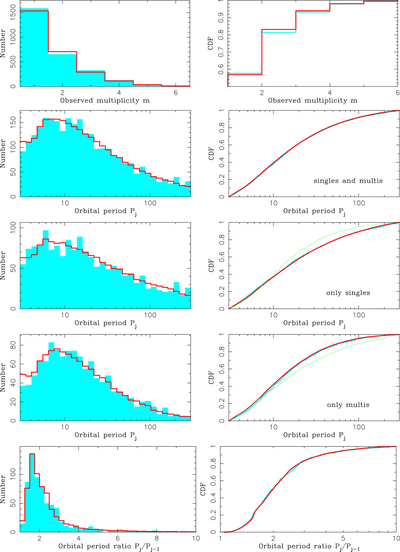
Caption: Figure 9.
The marginalized best-fit ﹩{{ \mathcal M }}_{{\rm{obs}}}﹩ from the ﹩{{ \mathcal M }}_{228}﹩ model (red lines) is compared to the marginalized ﹩{{ \mathcal D }}_{{\rm{kep}}}﹩ (blue histograms and blue lines). The two columns of plots show the differential (left) and cumulative distribution functions (right). From top to bottom, the rows of plots show the: (1) observed multiplicity (mobs), (2) orbital periods of all planets (Porb), (3) orbital periods of singles (planets in systems of observed multiplicity mobs = 1), (4) orbital periods of multis (observed multiplicity mobs ≥ 2), and (5) orbital period ratios of neighbor planets (Pj/Pj−1 for 2 ≤ j ≤ mobs). The green dashed lines in rows (3) and (4) are plotted for reference: the period distribution of multis in (3) and singles in (4).
Other Images in This Article
Show More
Copyright and Terms & Conditions
© 2026. The Author(s). Published by the American Astronomical Society.

