

Image Details
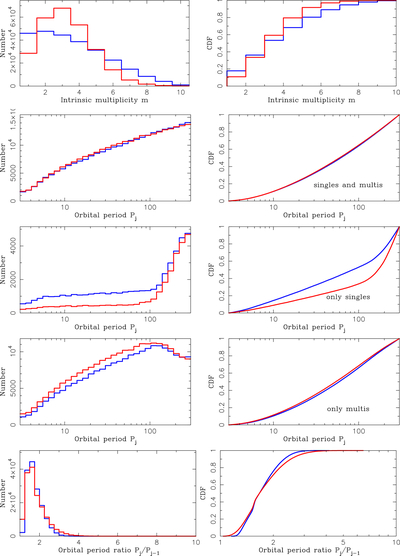
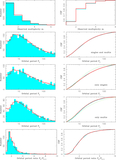
Caption: Figure 12.
The marginalized best-fit ﹩{{ \mathcal M }}_{{\rm{int}}}﹩ from the ﹩{{ \mathcal M }}_{228}﹩ (Poisson, red lines) and ﹩{{ \mathcal M }}_{235}﹩ (Zipfian, blue lines) models. The two columns of plots show the differential (left) and cumulative distribution functions (right). From top to bottom, the rows of plots show the: (1) intrinsic multiplicity (mint), (2) orbital periods of all planets (Porb), (3) orbital periods of singles (planets in systems of intrinsic multiplicity mint = 1), (4) orbital periods of multis (intrinsic multiplicity mint ≥ 2), and (5) orbital period ratios of neighbor planets (Pj/Pj−1 for 2 ≤ j ≤ mint). Note that the top plots show the planet multiplicity, as defined in Section 2.2.2, and not the system multiplicity as in W. Zhu et al. (2018) or M. Y. He et al. (2020).
Other Images in This Article
Show More
Copyright and Terms & Conditions
© 2026. The Author(s). Published by the American Astronomical Society.

