

Image Details
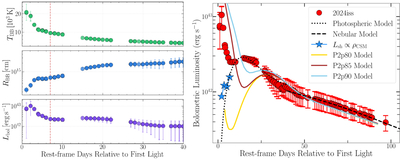
Caption: Figure 6.
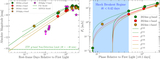
Left: blackbody temperature (top), blackbody radius (middle), and bolometric luminosity (bottom) of SN 2024iss at early times, as calculated using superbol (M. Nicholl 2018) for δt < 40 days. The dashed vertical line shows values at δt = 7 days. Right: bolometric light curve of SN 2024iss (red circles), with best-fit photospheric and nebular light-curve models (see Section 3.4) shown as dotted and dashed lines, respectively. Radiated luminosity from CSM interaction power (ϵrad = 30%) using CSM densities inferred from X-ray detections (see Section 5) is shown as blue stars. Binary progenitor model light curves from L. Dessart et al. (2024) are shown as solid blue, yellow, and brown lines (Section 4.3) representing a range of ejecta and H-rich envelope masses of Mej = 2.3–2.5 M⊙ and Menv = 0.02–0.12 M⊙.
Other Images in This Article
Show More
Copyright and Terms & Conditions
© 2026. The Author(s). Published by the American Astronomical Society.

