

Image Details
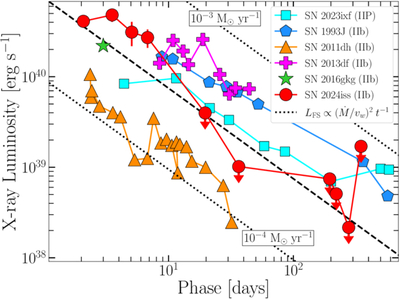
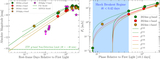
Caption: Figure 3.
Unabsorbed 0.3–10 keV light curve of SN 2024iss (red circles) compared to those of SNe IIb 1993J (blue polygons), 2011dh (orange triangles), and 2013df (magenta plus signs), as well as that of the Type II SN 2023ixf (cyan squares). Black dotted lines represent the analytic prediction for the free–free emission from the forward-shock luminosity (R. A. Chevalier & C. Fransson 2003, 2017) produced at different mass-loss rates and assuming a wind velocity of vw = 100 km s−1.
Other Images in This Article
Show More
Copyright and Terms & Conditions
© 2026. The Author(s). Published by the American Astronomical Society.

Copyright ©
2026 Astronomy Image Explorer. All Rights Reserved.
