

Image Details
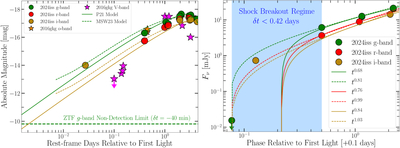
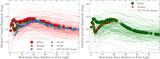
Caption: Figure 5.
Left: multiband photometry of SN 2024iss (circles) compared to first detections of SN IIb 2016gkg in the V band (stars) from M. C. Bersten et al. (2018). The horizontal dashed line represents the last nondetection limit in the g band at 1.33 hr before the first i-band detection. Solid and dashed lines represent best-fit shock-cooling models from A. L. Piro et al. (2021) and J. Morag et al. (2023). There is a significant deviation from model predictions at δt < 0.1 day, likely connected to shock-breakout emission. Right: power-law model fits to early multiband photometry with (dashed lines) and without (solid lines) the inclusion of the earliest i-band detection. Dashed lines represent fits that force the last g-band nondetection as the time of first light, and Fν,g > Fν,r > Fν,i show that the i-band point cannot be fit with a single power-law index.
Other Images in This Article
Show More
Copyright and Terms & Conditions
© 2026. The Author(s). Published by the American Astronomical Society.

