

Image Details
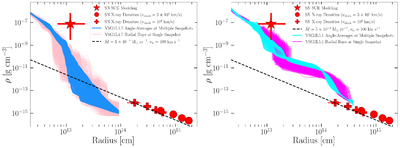
Caption: Figure 17.
Progenitor envelope and CSM density profile derived from the best-fit spherical shock-cooling light-curve models, shown as the red star (Section 3.5), and the emission measures derived from modeling of the X-ray spectra, shown as red plus signs and circles for different assumed shock velocities (Section 5). The spherically averaged density profiles for the YSG 1L4.7 (left) and YSG 1L5.1 (right) SN IIb progenitor models of J. A. Goldberg et al. (2026) are shown in blue/cyan (angle averages of individual model snapshots over a select time window) and pink/magenta (multiple viewing angles) lines.
Other Images in This Article
Show More
Copyright and Terms & Conditions
© 2026. The Author(s). Published by the American Astronomical Society.

