

Image Details
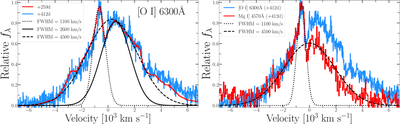
Caption: Figure 16.
Left: velocity profiles for [O I] λ6300 at δt = 259 days (red) and 412 days (blue). Gaussian profile fits shown in black demonstrate the potentially asymmetric distribution of O within the inner ejecta. Right: comparison of the [O I] λ6300 and Mg I] λ4570 velocity profiles, both displaying double-peaked profiles suggestive of clumping and/or asymmetries with the inner ejecta.
Other Images in This Article
Show More
Copyright and Terms & Conditions
© 2026. The Author(s). Published by the American Astronomical Society.

Copyright ©
2026 Astronomy Image Explorer. All Rights Reserved.
