

Image Details
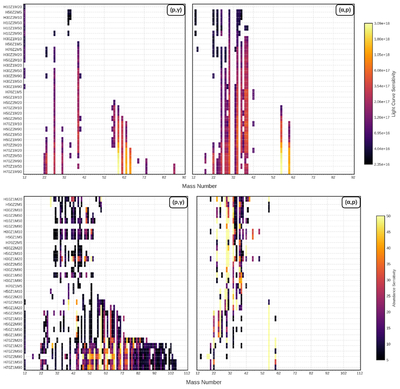
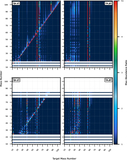
Caption: Figure 8.
Visualization of the impact of individual nuclear reaction rates across all 32 systems in our study. Each panel shows the impact factor as a function of the target nucleus’s mass number and the model parameters. The models are ordered by XH,ign (Table 1), with the most hydrogen-rich bursts placed at the bottom of the y-axis. For each mass number, we only include the reaction variation with the highest impact factor (see Tables 2 and 3). Top row: sensitivity factor for impact on the burst light curve (Equation (3)), separated by (p, γ) and (α, p) reactions (left and right panels, respectively). Bottom row: sensitivity factor for impact on the final abundances (Equation (4)), separated by (p, γ) and (α, p) reactions (left and right panels, respectively). In Figures 8–10, the three (p, α) reactions (39K(p, α)36Ar, 59Cu(p, α)56Ni, and 63Ga(p, α)60Zn) are represented using the inverse (α, p) notation.
Other Images in This Article
Copyright and Terms & Conditions
© 2026. The Author(s). Published by the American Astronomical Society.

