

Image Details
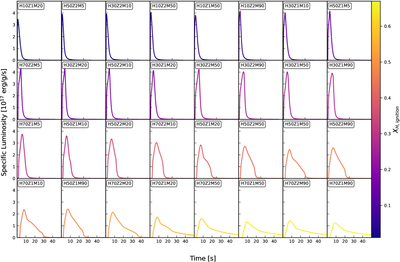
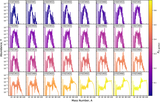
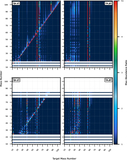
Caption: Figure 4.
Baseline XRB light curves for 32 systems. Panels are arranged so that XH,ign decreases from the bottom right toward the top left, with the top row representing the most helium-rich cases. The color bar indicates the amount of hydrogen mass fraction at ignition (XH,ign).
Other Images in This Article
Copyright and Terms & Conditions
© 2026. The Author(s). Published by the American Astronomical Society.

Copyright ©
2026 Astronomy Image Explorer. All Rights Reserved.
