

Image Details
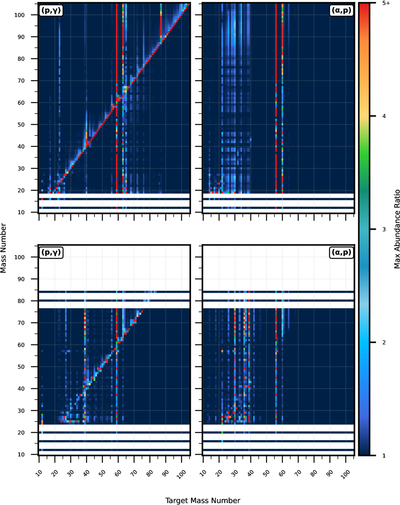
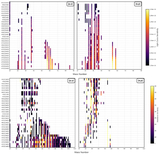
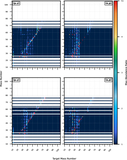
Caption: Figure 9.
Mass number change as a function of target mass of the reaction nuclei. The color bar represents the maximum ratio change of an isotopic abundance between the baseline and the changed reaction rate using Equation (4). The top panels are system H70Z2M50, and the bottom panels are system H50Z1M20. Each panel shows two different reaction types (p, γ) and (α, p), from left to right.
Other Images in This Article
Copyright and Terms & Conditions
© 2026. The Author(s). Published by the American Astronomical Society.

Copyright ©
2026 Astronomy Image Explorer. All Rights Reserved.
