

Image Details
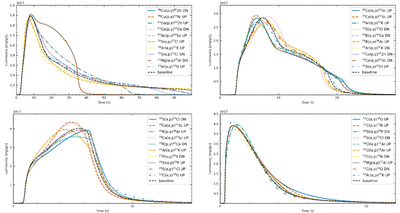
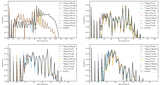
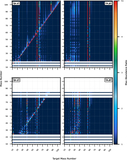
Caption: Figure 6.
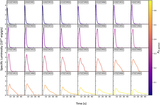
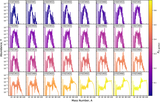
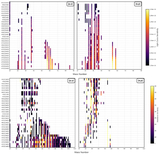
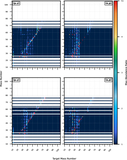
Model light curves for the baseline calculation using the REACLIB v2.2 reaction rates (baseline) and for calculations where individual reaction rates are varied by a factor of 100. The figure only shows results for the reaction rate variations that produced the 10 highest values for the light-curve sensitivity factor (Equation (3)). The four panels show results for binary systems with a variety of accretion parameters; from more hydrogen-rich to more helium-rich bursts, the models shown are H70Z2M50 (top left), H50Z1M20 (top right), H30Z2M90 (bottom left), and H30Z2M10 (bottom right). Note that more reactions exceed the sensitivity factor threshold as listed in Table 2.
Other Images in This Article
Copyright and Terms & Conditions
© 2026. The Author(s). Published by the American Astronomical Society.

