

Image Details
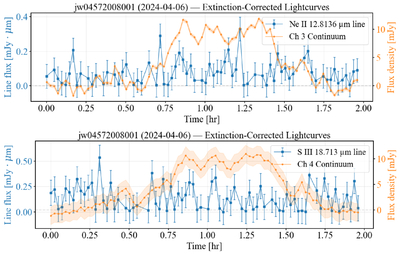
Caption: Figure 2.
Representative light curves for the 2024 observations showing the absence of correlated variability in both [S III] (18.713 μm) and [Ne II] (12.813 μm), shown in blue, in response to the Sgr A⋆ flare described in S. D. von Fellenberg et al. (2025b) and J. M. Michail et al. (2026). The corresponding continuum light curve is plotted in orange. For the emission-line light curves, the error bars show the rms scatter of the measured line fluxes around their median value and are used as an empirical visual estimate of the line-flux scatter. For the continuum light curves, the shaded bands show the photometric uncertainty propagated from the JWST pipeline error array. A full uncertainty analysis and comparison is described in Section 3.1.
Other Images in This Article
Copyright and Terms & Conditions
© 2026. The Author(s). Published by the American Astronomical Society.

