

Image Details
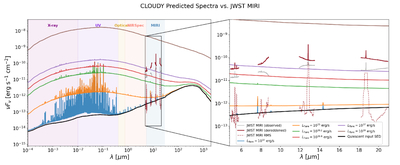
Caption: Figure 3.
Left: comparison of CLOUDY models to the observed JWST/MIRI spectrum of the central ﹩0\mathop{.}\limits^{^{\prime\prime} }3﹩ around Sgr A⋆. The crimson and gray curves show the MIRI MRS spectra, dereddened and observed, respectively, during the flare window, and the dashed crimson curve shows the local continuum-subtracted rms. Colored curves show the predicted flare-peak spectra for flare luminosities ﹩{L}_{{\rm{flare}}}=1{0}^{32}﹩–1039 erg s−1. The black curve shows the quiescent input SED (F. Yuan et al. 2003). For most flare models, the emission is continuum dominated, precluding the use of mid-infrared line emission to constrain the UV flux of Sgr A⋆. Right: zoom-in to MIRI MRS wavelengths
Other Images in This Article
Copyright and Terms & Conditions
© 2026. The Author(s). Published by the American Astronomical Society.

