

Image Details
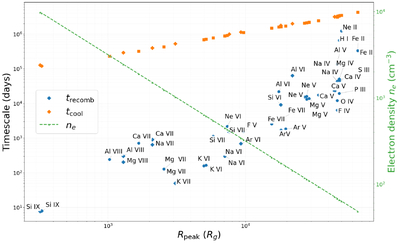
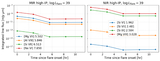
Caption: Figure 5.
Recombination time (blue points), cooling time (orange squares; computed assuming a representative cooling coefficient of 10−22 erg cm3 s−1), and density (green diamonds) as a function of the radius at which each ion reaches peak emissivity. Ion labels are shown above the recombination-time points. Even the shortest recombination timescale is of order ∼8 days, far exceeding the characteristic variability timescale of ∼1 hr.
Other Images in This Article
Copyright and Terms & Conditions
© 2026. The Author(s). Published by the American Astronomical Society.

Copyright ©
2026 Astronomy Image Explorer. All Rights Reserved.
