

Image Details
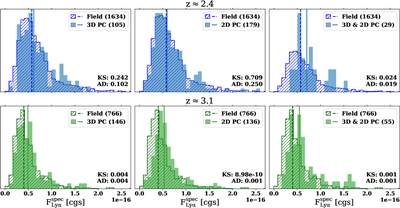
Caption: Figure 10.
Histograms of ﹩{F}_{{\rm{Ly}}\alpha }^{{\rm{spec}}}﹩ for protocluster (filled) and field (hatched) samples at z ≈ 2.4 (top) and z ≈ 3.1 (bottom). The left (middle) panels show 3D (2D) protocluster member galaxies, while the right panels show galaxies identified as members by both 2D and 3D selection. Field galaxies are chosen to have local density δLAE,2D at the 50%-tile or below. Vertical solid (dashed) lines mark the median line fluxes of the protocluster (field) sample. The KS and AD test p-values, comparing the two distributions, are listed in the bottom right of each panel.
Other Images in This Article
Copyright and Terms & Conditions
© 2026. The Author(s). Published by the American Astronomical Society.

Copyright ©
2026 Astronomy Image Explorer. All Rights Reserved.
