

Image Details
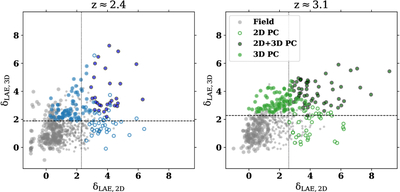
Caption: Figure 9.
Comparison of overdensities in 2D and 3D space for LAEs at z ≈ 2.4 (left) and z ≈ 3.1 (right). Each point indicates an individual LAE, color-coded by its protocluster classification. Open (filled) circles denote members of the 2D (3D) sample only, and filled circles with a black outline denote members of both 2D and 3D protoclusters. Gray circles are field galaxies, while smaller gray dots are galaxies not in any sample. The dashed line marks the corresponding δLAE,3D threshold used to define 3D protoclusters, and the dotted line marks the δLAE,2D threshold.
Other Images in This Article
Copyright and Terms & Conditions
© 2026. The Author(s). Published by the American Astronomical Society.

Copyright ©
2026 Astronomy Image Explorer. All Rights Reserved.
