

Image Details
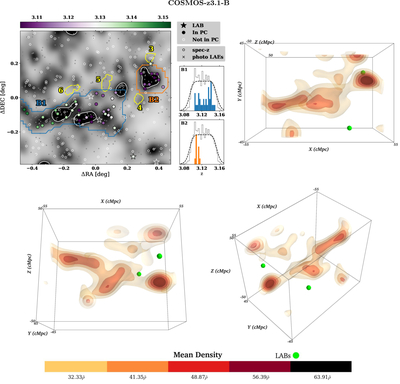
Caption: Figure 3.
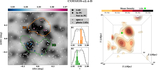
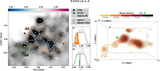
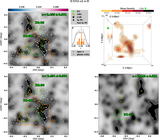
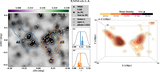
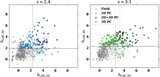
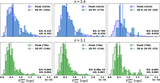
Top left: LAE surface density map around COSMOS-z3.1-B, shown in gray scale as in Figure 1; the pointing center is listed in Table 2. Blue and orange contours mark the projected 3D density peaks B1 and B2, while white contours indicate 2D protocluster candidates identified from the 2D LAE overdensity map (V. Ramakrishnan et al. 2024, 2025a). LAEs with spectroscopic redshifts in B1 and B2 are shown as filled circles, color-coded by redshift; spectroscopic sources that fall outside these 3D density peaks are shown as open circles. LABs are shown as stars, and all photometric LAEs as gray crosses. Yellow contours denote protocluster candidates identified by (J. Toshikawa et al. 2024). Side panels show the redshift distributions of confirmed galaxies in each 3D peak (colored histograms), with the overall distribution shown in gray and the filter transmission curve as a dashed line. Top right: reconstructed 3D model of COSMOS-z3.1-B viewed along the same line of sight, with densities relative to the mean field indicated by the color bar; confirmed LABs are shown as green spheres. Bottom panels show the 3D model from two additional viewing angles. An interactive version of the 3D reconstruction is available on GitHub (ortiz140.github.io/odin/) and in the online article. The figures can be explored using mouse controls for panning, zooming, and rotation. Additional information about these controls is available here.
An interactive version of this figure is available in the online article.
An interactive version of this figure is available.
An interactive version of this figure is available in the online journal.
Other Images in This Article
Copyright and Terms & Conditions
© 2026. The Author(s). Published by the American Astronomical Society.

