

Image Details
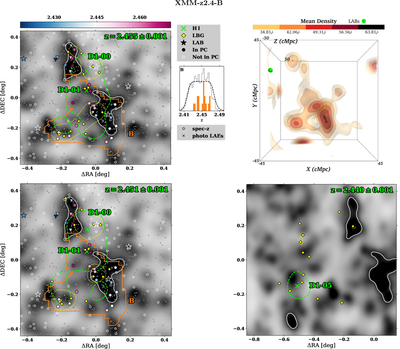
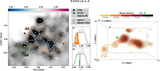
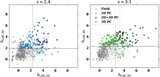
Caption: Figure 7.
Similar to Figure 3 but for XMM-z2.4-B. In the top-left, bottom-left, and bottom-right panels, green dashed contours mark the LATIS Lyα absorption isosurface at δF/σmap = −2 (see Footnote for the definition of this quantity), reported by A. B. Newman et al. (2025a). These contours trace regions of enhanced H I absorption around the highest-significance LATIS peaks identified in their analysis, in three redshift slices corresponding to D1-00, D1-01, and D1-05, respectively, whose centers are indicated by green crosses. In the bottom-right panel, the field center is shifted by ≈0.5 deg eastward to show D1-05. Yellow dotted contours mark the projected LATIS LBG overdensity contour at δLBG/σ = 2, and yellow diamonds indicate individual LBG/QSO positions at these redshift slices from LATIS. The background gray scale is the 2D LAE surface density map. The downward triangles in the two left panels mark spectroscopic sources overlapping with D1-00; while these sources are not formally part of XMM-z2.4-B in our 3D detection, they reside in a 2D-selected protocluster whose angular extent overlaps significantly with D1-00 (see text for more discussion).
An interactive version of this figure is available in the online article.
An interactive version of this figure is available.
An interactive version of this figure is available in the online journal.
Other Images in This Article
Copyright and Terms & Conditions
© 2026. The Author(s). Published by the American Astronomical Society.

