

Image Details
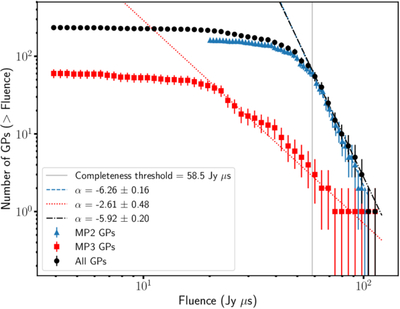
Caption: Figure 6.
Cumulative fluence distributions of the detected giant pulses from the MP2 (blue triangles), MP3 (red squares), and combined (black circles) samples. The error bars correspond to Poissonian errors. The vertical gray line marks the fluence completeness threshold. The dashed lines show the best-fit power-law models fitted above the completeness threshold.
Other Images in This Article
Copyright and Terms & Conditions
© 2026. The Author(s). Published by the American Astronomical Society.

Copyright ©
2026 Astronomy Image Explorer. All Rights Reserved.
