

Image Details
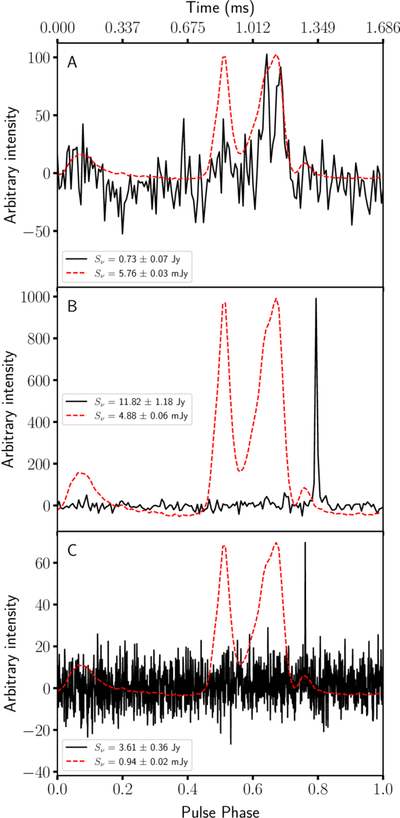
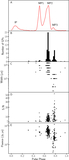
Caption: Figure 3.
Three examples of GPs detected during our search. The average profile of PSR J1227−4853 is overlaid in red. The mean flux density during the observation epoch and the flux density of the GP (calculated using the radiometer equation) are also labeled. Panel (A): one of the broadest GPs (S/N = 12.54, width = 143.36 μs). Panel (B): the brightest GP (S/N = 54.98, width = 10.24 μs). Panel (C): one of the narrowest GPs (S/N = 8.57, width = 1.28 μs).
Other Images in This Article
Copyright and Terms & Conditions
© 2026. The Author(s). Published by the American Astronomical Society.

Copyright ©
2026 Astronomy Image Explorer. All Rights Reserved.
