

Image Details
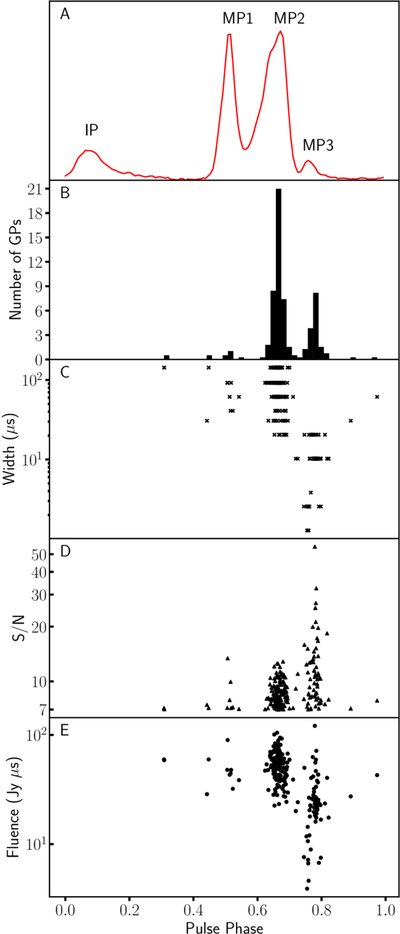
Caption: Figure 5.
Panel (A): average pulse profile for PSR J1227−4853 (in arbitrary units). The interpulse (IP) and the three main-pulse components are marked (MP1, MP2, and MP3). Panel (B): distribution of the number of GPs detected at different pulse phases. Panel (C): distribution of GP widths across pulse phases. Panel (D): distribution of GP S/N across pulse phases. Panel (E): distribution of GP fluences across pulse phases.
Other Images in This Article
Copyright and Terms & Conditions
© 2026. The Author(s). Published by the American Astronomical Society.

Copyright ©
2026 Astronomy Image Explorer. All Rights Reserved.
