

Image Details
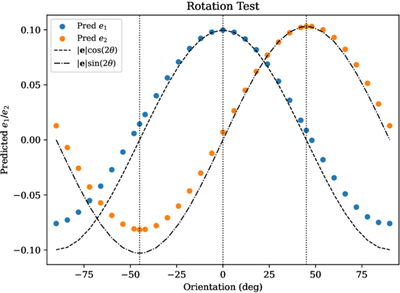
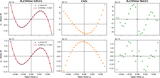
Caption: Figure 7.
Transformation of measured shape under rotation for our CNN model, as in Figure 3. The same galaxy profile with fixed ellipticity (e = 0.4) but different orientations (−90° to +90° between the x-axis and the major axis) is fed into the model. The predicted e1 and e2 components (blue and orange points) are compared against theoretical sine/cosine functions (dashed and dashed–dotted curves) scaled to match the measured amplitude. The vertical dotted lines mark the key reference angles at −45°, 0°, and +45°.
Other Images in This Article
Copyright and Terms & Conditions
© 2026. The Author(s). Published by the American Astronomical Society.

Copyright ©
2026 Astronomy Image Explorer. All Rights Reserved.
