

Image Details
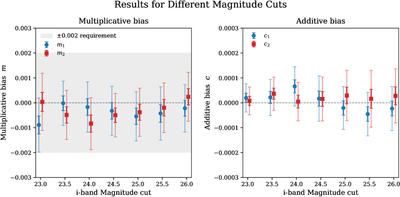
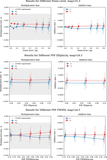
Caption: Figure 5.
Shear estimation results for galaxies with different i-band magnitude cuts. The shaded gray region in the multiplicative-bias panels denotes the LSST requirement of ∣m∣ < 0.002. The left panels show the multiplicative bias m1 (blue) and m2 (red), while the right panels show the additive bias c1 (blue) and c2 (red). The points indicate the mean bias estimates, with the error bars corresponding to 1σ (deep color) and 3σ (light color) statistical uncertainties, with bootstrap resampling 20 times. The data points are horizontally slightly shifted from the original value to avoid overlap. With different magnitude cuts, both multiplicative and additive biases remain consistent with zero within the errors, demonstrating the accuracy of the calibrated ML-based shear estimator.
Other Images in This Article
Copyright and Terms & Conditions
© 2026. The Author(s). Published by the American Astronomical Society.

