

Image Details
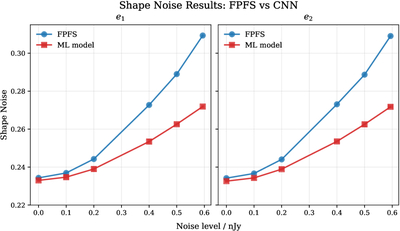
Caption: Figure 6.
Shape-noise comparison between our CNN model (red squares) and FPFS (blue circles) as a function of image noise level. The highest noise level corresponds to the standard deviation expected for LSST 10 yr coadded i-band images with a magnitude cut mcut = 24.5. While both methods achieve comparable shape noise at low noise levels, the CNN model shows a ∼10% reduction in shape noise in the high-noise regime, demonstrating the improved noise robustness and effective denoising capability of the ML-based approach.
Other Images in This Article
Copyright and Terms & Conditions
© 2026. The Author(s). Published by the American Astronomical Society.

Copyright ©
2026 Astronomy Image Explorer. All Rights Reserved.
