

Image Details
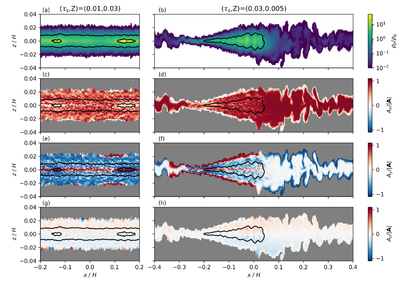
Caption: Figure 6.
The vertical structure of the simulations, where x is the radial direction and z is the vertical direction. The left and right columns correspond to simulations with (τs, Z) = (0.01, 0.03) and (0.03, 0.005), respectively. The top row is the dust-to-gas ratio ϵ. The second, third, and last rows correspond to the radial, azimuthal, and vertical components (Ax, Ay, and Az), respectively, of the aerodynamic flow A. The gray regions are where ϵ < 10−5. The black contours show where ϵ = 1 and 10. Since the dust is highly settled, the horizontal axis covers much more length than the vertical axis for easier visualization.
Other Images in This Article
Copyright and Terms & Conditions
© 2026. The Author(s). Published by the American Astronomical Society.

