

Image Details
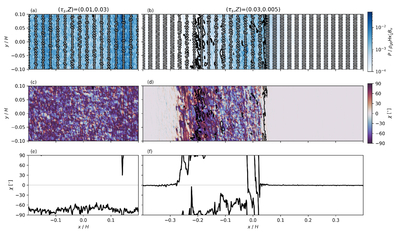
Caption: Figure 2.
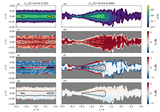
The polarization images for the two simulations. The left and right columns correspond to simulations with (τs, Z) = (0.01, 0.03) and (0.03, 0.005), respectively. The top row shows the polarized intensity, with overplotted vectors denoting the polarization angles χ. The second row shows the map of χ, where χ = 0° is in the radial direction and χ = ±90° is in the azimuthal direction. The color map is cyclic, i.e., χ = 90° is equivalent to χ = −90°. The black contours for both rows mark where ϵ = 1. The bottom row shows the azimuthally averaged χ by averaging Stokes Q and U in the y-axis and then utilizing Equation (7). Values of χ ∈ (0°, 90°) are leading spirals, while values of χ ∈ (−90°, 0°) are trailing spirals.
Other Images in This Article
Copyright and Terms & Conditions
© 2026. The Author(s). Published by the American Astronomical Society.

