

Image Details
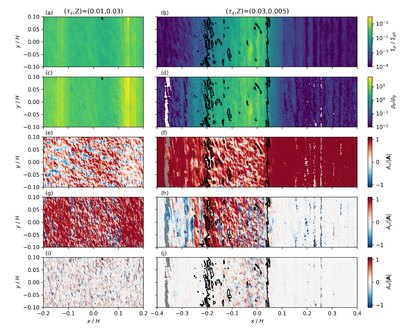
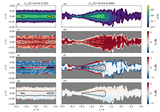
Caption: Figure 1.
Structure of the simulations, where x is the radial direction and y is the azimuthal direction. The left and right columns correspond to simulations with (τs, Z) = (0.01, 0.03) and (0.03, 0.005), respectively. The top row is the dust surface density Σp, while the second row is the dust-to-gas ratio ϵ at the midplane. The third, fourth, and last rows correspond to the radial, azimuthal, and vertical components (Ax, Ay, and Az) of the aerodynamic flow A at the midplane. For reference, the median values of ∣A∣ at the midplane are 6 × 10⁻⁴cs and 2.8 × 10⁻³cs, respectively. In all panels, the black contours show where ϵ = 1. For (τs, Z) = (0.01, 0.03), ϵ > 1 almost everywhere in the midplane. The gray regions for (τs, Z) = (0.03, 0.005) in panels (f), (h), and (j) are where there is no dust present. The two simulations demonstrate that A show strong positive, azimuthal components (tailwind) where ϵ > 1.
Other Images in This Article
Copyright and Terms & Conditions
© 2026. The Author(s). Published by the American Astronomical Society.

