

Image Details
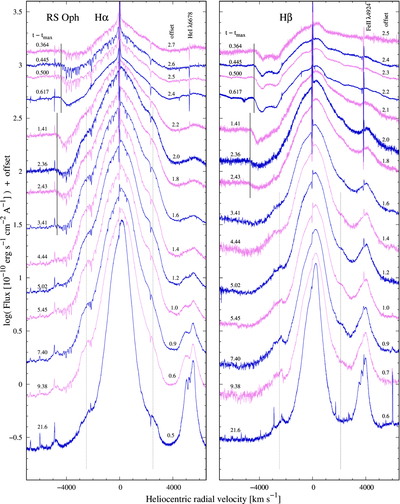
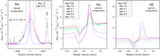
Caption: Figure 13.
Evolution of the Hα (left) and Hβ (right) line profiles during the first hours and days of the RS Oph explosion. Vertical gray lines denote the terminal velocity of the broad absorption component, while the dotted lines denote emission bumps located around ±2500 km s−1.
Other Images in This Article
Show More
Copyright and Terms & Conditions
© 2026. The Author(s). Published by the American Astronomical Society.

Copyright ©
2026 Astronomy Image Explorer. All Rights Reserved.
