

Image Details
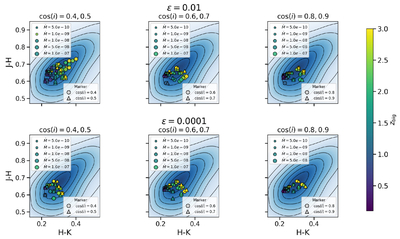
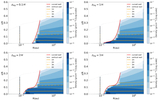
Caption: Figure 9.
KDE maps of the observed dereddened JHK colors (blue region), with relative density isocontours shown at values of 9, 7.5, 6, 4.5, 3, and 1.5, from innermost (highest relative density) to outermost (lowest relative density). The colored symbols correspond to models with curved walls for different ﹩\cos (i)﹩ as indicated by the labels. The first row shows models with ϵ = 0.01 and the second row models with ϵ = 0.0001. The size of the symbol increases with ﹩\dot{M}﹩ and the color indicates the values for zbig. We show models for a 0.5 M⊙, 1 Myr old star.
Other Images in This Article
Copyright and Terms & Conditions
© 2026. The Author(s). Published by the American Astronomical Society.

Copyright ©
2026 Astronomy Image Explorer. All Rights Reserved.
