

Image Details
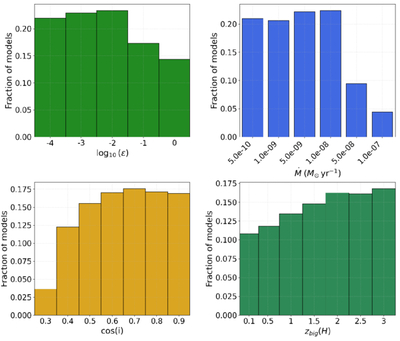
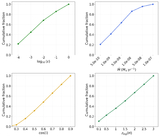
Caption: Figure 10.
Distributions of ﹩\mathrm{log}(\epsilon )﹩ (upper left), ﹩\dot{M}﹩ (upper right), ﹩\cos (i)﹩ (lower left), and zbig (lower right) of the disk models that populate the region defined by the two innermost relative density isocontours (with KDE values 9 and 7.5) of the observations.
Other Images in This Article
Copyright and Terms & Conditions
© 2026. The Author(s). Published by the American Astronomical Society.

Copyright ©
2026 Astronomy Image Explorer. All Rights Reserved.
