

Image Details
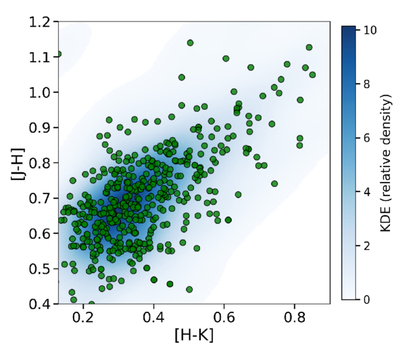
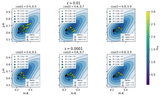
Caption: Figure 1.
Color–color diagram in the JHK bands for our CTTS sample (green points). The shaded blue region is the corresponding normalized two-dimensional KDE map, assuming a Gaussian kernel.
Other Images in This Article
Copyright and Terms & Conditions
© 2026. The Author(s). Published by the American Astronomical Society.

Copyright ©
2026 Astronomy Image Explorer. All Rights Reserved.
