

Image Details
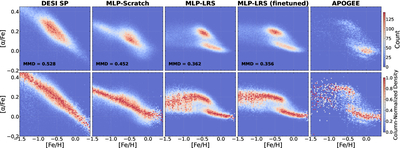
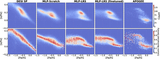
Caption: Figure 3.
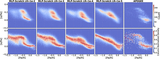
[α/Fe]–[Fe/H] diagrams for DESI EDR and APOGEE reference sample. From left to right: (1) DESI SP: DESI SP pipeline, (2) MLP-Scratch: MLP trained from scratch on the same number of DESI spectra used for fine-tuning, (3) MLP-LRS: MLP pretrained on LAMOST LRS (zero-shot application), (4) MLP-LRS (fine-tuned): MLP pretrained on LAMOST LRS and fine-tuned with DESI spectra, and (5) APOGEE: DESI DR1–APOGEE DR17 crossmatched sample (7608 stars). The first row shows raw counts, and the second row shows column-normalized densities, where each [Fe/H] column is divided by its maximum count. The legend reports the maximum mean discrepancy (MMD) between each sample and the APOGEE reference.
Other Images in This Article
Show More
Copyright and Terms & Conditions
© 2026. The Author(s). Published by the American Astronomical Society.

