

Image Details
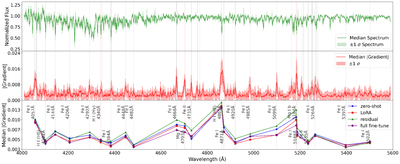
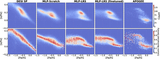
Caption: Figure B1.
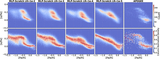
Saliency maps of the output iron abundance with respect to the input spectra in the rest frame. The upper panel shows the median and 1σ dispersion of the normalized spectra for the testing metal-poor subset ([Fe/H]). The middle panel presents the saliency maps (absolute gradients; median and 1σ) for the residual-head fine-tuning, indicating the sensitivity of the output iron abundance to different spectral regions. The lower panel highlights selected spectral lines with prominent sensitivity, comparing all fine-tuning strategies and the zero-shot results. Lines (from A. Kramida et al. 2024) corresponding to major spikes are shown in gray (iron) and red (noniron) in the upper and middle panels, and selectively plotted in the lower panel.
Other Images in This Article
Show More
Copyright and Terms & Conditions
© 2026. The Author(s). Published by the American Astronomical Society.

