

Image Details
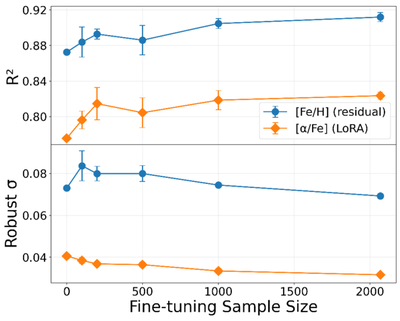
Caption: Figure 4.
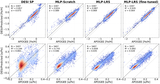
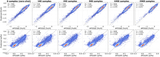
Effect of fine-tuning sample size (0, 100, 200, 500, 1000, and 2069, where zero denotes zero-shot performance), evaluated on the testing sample. Shown are R2 and the robustly estimated standard deviation of the residuals (σ) for [Fe/H] and [α/Fe], obtained after fine-tuning (residual-head fine-tuning for [Fe/H] and LoRA fine-tuning for [α/Fe]). For both metrics, we plot the mean and 1σ error bars from five independent runs. The scatterplots for the different sample sizes are shown in Figures A1 and A2.
Other Images in This Article
Show More
Copyright and Terms & Conditions
© 2026. The Author(s). Published by the American Astronomical Society.

Copyright ©
2026 Astronomy Image Explorer. All Rights Reserved.
