

Image Details
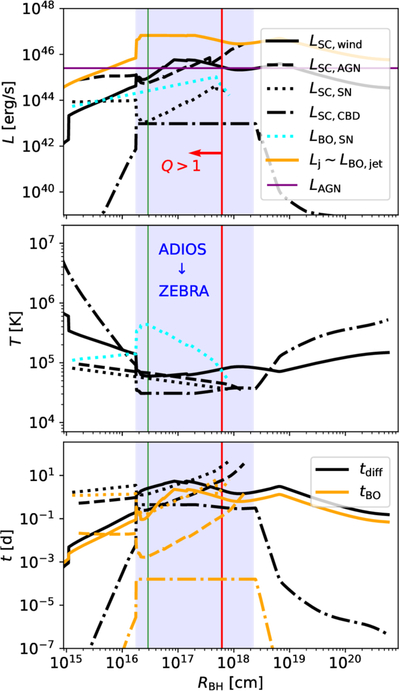
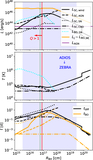
Caption: Figure 8.
Properties of EM flares in the TQM model with MSMBH = 108 M⊙ and ﹩{\dot{M}}_{{\rm{SMBH}}}={\dot{M}}_{{\rm{Edd}}}﹩. Black lines in the upper, middle, and lower rows represent the radiation luminosity, the radiation temperature, and diffusion timescale for the shock-cooling emission, respectively. Orange lines in the upper row represent the jet kinetic power, while those in the bottom row represent the delay time of shock-breakout emission. Solid, dashed, and dashed–dotted lines correspond to emission from shocks in winds, AGN-disk gas, and CBDs shocked by jets, respectively, while dotted lines represent emission from AGN-disk gas shocked by SN explosions. Dotted cyan lines in the upper and middle panels show the breakout luminosity and temperature for shocks in AGN-disk gas caused by SN explosions. Vertical green and red lines mark the locations where the disk aspect ratio is maximized and where the Toomre parameter exceeds 1, respectively. The horizontal purple lines represent the AGN luminosity at optical bands, assuming a bolometric correction factor of 5 (F. Duras et al. 2020). The blue-shaded regions represent where the ADIOS state transitions to the ZEBRA state as a result of kicks at mergers or interactions. The cooling emission from winds and AGN-disk gas shocked by jets can be as luminous as the host AGN in the optical-UV bands in the middle regions (∼0.01–1 pc) with durations of ∼0.1–10 days.
Other Images in This Article
Show More
Copyright and Terms & Conditions
© 2026. The Author(s). Published by the American Astronomical Society.

