

Image Details
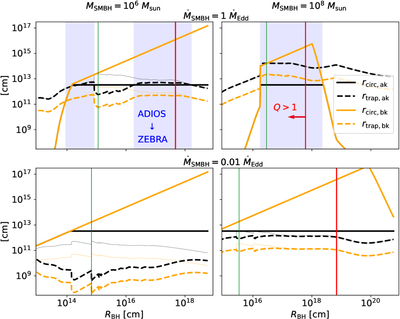
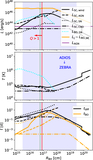
Caption: Figure 2.
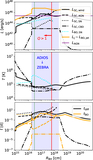
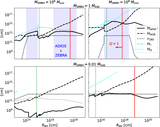
The trapping radius (dashed curves) versus circularization radius (solid curves) for accretion onto individual BHs in the AGN disk, as a function of distance from the SMBH in the TQM model. The orange and black lines represent the radii before and after recoil kicks, respectively. The left and right panels show results for MSMBH = 106 and 108 M⊙, while the upper and lower panels correspond to ﹩{\dot{M}}_{{\rm{SMBH}}}={\dot{M}}_{{\rm{Edd}}}﹩ and ﹩0.01\,{\dot{M}}_{{\rm{Edd}}}﹩, respectively. Thick lines indicate results considering gap formation around BHs, while thin lines neglect this effect. The vertical green and red lines mark the locations where HAGN/RBH reaches a minimum and where the Toomre parameter becomes Q≥1, respectively. The blue-shaded regions represent where the ADIOS state transitions to the ZEBRA state as a result of kicks at mergers or interactions.
Other Images in This Article
Show More
Copyright and Terms & Conditions
© 2026. The Author(s). Published by the American Astronomical Society.

