

Image Details
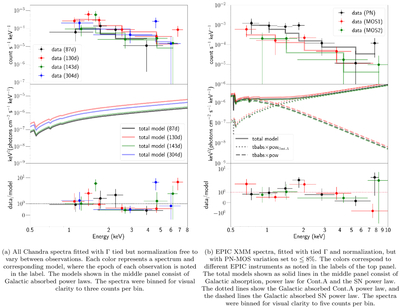
Caption: Figure 2.
Fits for SN 2018bsz. The top panels show the spectra (points) and fitted model (thicker lines), the middle panels show the full model (and different model components for XMM), and the bottom panels show the log ratio of data to model.
Other Images in This Article
Copyright and Terms & Conditions
© 2026. The Author(s). Published by the American Astronomical Society.

Copyright ©
2026 Astronomy Image Explorer. All Rights Reserved.
