

Image Details
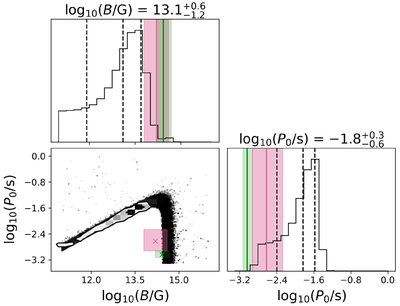
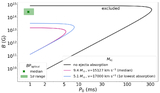
Caption: Figure 4.
Corner plot of the MCMC run for B and P0. The black dashed lines in the top left and bottom right show the median and 1σ ranges for the best-fit parameters, which are given at the top of the respective histogram. The contour lines in the bottom left panel represent 1σ and 2σ. The green regions correspond to BPoptical with 1σ distribution, and best-fit optical values are marked as a dark green cross and lines. The pink lines and shaded regions correspond to the median B and P0 with a corresponding 1σ distribution from the results of the full sample of 262 SLSNe by S. Gomez et al. (2024).
Other Images in This Article
Copyright and Terms & Conditions
© 2026. The Author(s). Published by the American Astronomical Society.

Copyright ©
2026 Astronomy Image Explorer. All Rights Reserved.
