

Image Details
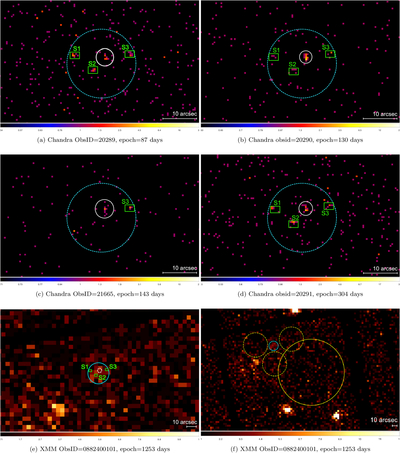
Caption: Figure 1.
(a)–(d): Chandra images in the 0.5–8 keV energy range. (e) and (f): XMM EPIC-pn image in the 0.5–10 keV energy range. In panels (a)–(e), the solid circles indicate the source regions used in each observation, while dashed circles mark the reference source regions from the other telescope. In the Chandra panels (a)–(d), the solid white circles correspond to the Chandra source and the dashed cyan circles to the equivalent XMM EPIC-pn source region; in the XMM panel (e), the solid cyan circle corresponds to the XMM EPIC-pn source region, and the dashed white circle indicates the Chandra source region from observation 20291. The additional X-ray sources (S1)–(S3) close to the SN position in the Chandra images are also marked by green rectangles in panels (a)–(e). The color bar in each panel corresponds to the count rate in each pixel. Note the different fields of view for the Chandra and XMM images, as indicated by the scale bars in the lower right corners. Panel (f) shows the XMM image over a larger field of view, with the corresponding source region (cyan) and background region (solid yellow) used for spectral extraction. The dashed yellow circles are alternative background regions that were investigated.
Other Images in This Article
Copyright and Terms & Conditions
© 2026. The Author(s). Published by the American Astronomical Society.

