

Image Details
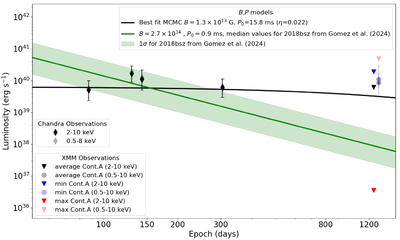
Caption: Figure 3.
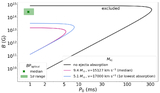
Magnetar evolution models compared with observational data. The black solid line shows the best-fit B and P0 with fixed η from the MCMC fit. The green line and shaded region show the pulsar model with best-fit values of B and P0 for the optical light-curve fit of SN 2018bsz from S. Gomez et al. (2024). The diamonds are the power-law luminosities from Chandra, and the triangles (3σ upper limits) and dots (detections) are from XMM. All error bars represent 90% uncertainty. Three different colors (black, blue, and red) are shown for the XMM results and correspond to the average, min Cont.A, and max Cont.A, respectively. The former limit was used in the magnetar fits. Finally, the darker colors are X-ray luminosities in the energy range 2–10 keV, and the lighter colors are 0.5–8 keV for Chandra and 0.5–10 keV for XMM. The 0.5–10 keV XMM data points have been shifted +60 days for visual clarity.
Other Images in This Article
Copyright and Terms & Conditions
© 2026. The Author(s). Published by the American Astronomical Society.

