

Image Details
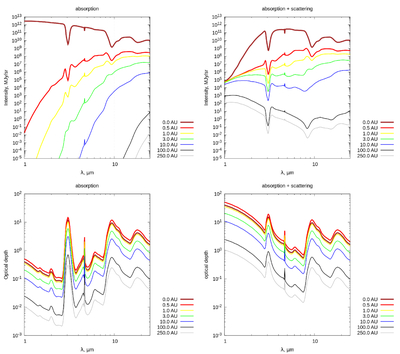
Caption: Figure 13.
Top line: SEDs at different impact distances for the model with only absorption (left panel) and for the model with both absorption and scattering (right panel). Bottom line: spectral distributions of optical depth at different impact distances for the true absorption model (left panel) and full model (right panel). The corresponding impact distances are shown in the color legend.
Other Images in This Article
Show More
Copyright and Terms & Conditions
© 2026. The Author(s). Published by the American Astronomical Society.

Copyright ©
2026 Astronomy Image Explorer. All Rights Reserved.
