

Image Details
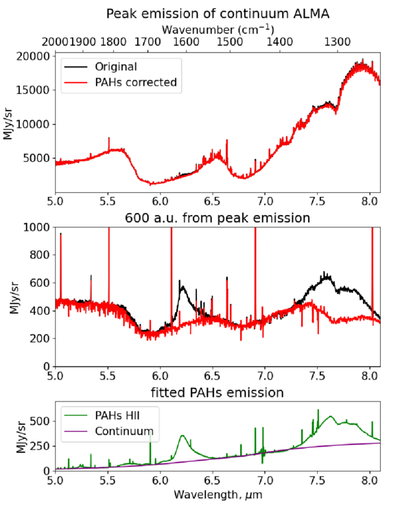
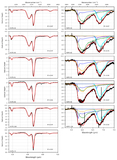
Caption: Figure 3.
PAH correction for HOPS-60. Black lines show observed spectra, red lines show corrected PAH spectra, and the green line shows the PAH H II spectrum from R. Chown et al. (2024). Top panel: pixel at the peak of ALMA continuum emission. Middle panel: pixel 600 au away from the peak of ALMA continuum emission. Bottom panel: H II PAH emission from R. Chown et al. (2024).
Other Images in This Article
Show More
Copyright and Terms & Conditions
© 2026. The Author(s). Published by the American Astronomical Society.

Copyright ©
2026 Astronomy Image Explorer. All Rights Reserved.
