

Image Details
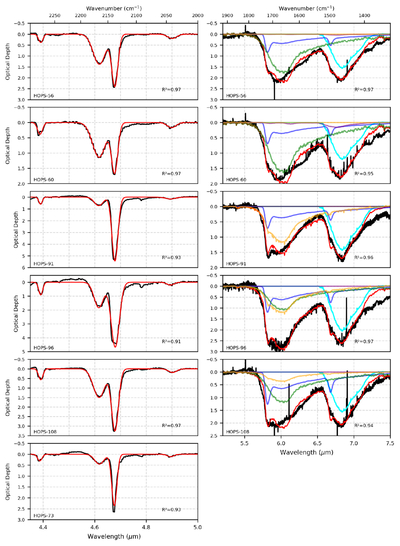
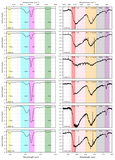
Caption: Figure 6.
Optical depth spectra toward the ALMA continuum intensity peak of the sources. The red line shows the best fit for each spectrum, and the black line shows the optical depth spectrum. The R2 of the fits is shown in the lower right corners. Left panels: Gaussian fits of 13CO2, OCN−, CO, and OCS. Right panels: colored lines show the components of the laboratory spectra of H2CO:H2O (blue), H2O (green), NH﹩{}_{4}^{+}﹩ (15 K, purple), H2O:CO:CO2 (orange), and NH﹩{}_{4}^{+}﹩(120 K, cyan).
Other Images in This Article
Show More
Copyright and Terms & Conditions
© 2026. The Author(s). Published by the American Astronomical Society.

Copyright ©
2026 Astronomy Image Explorer. All Rights Reserved.
