

Image Details
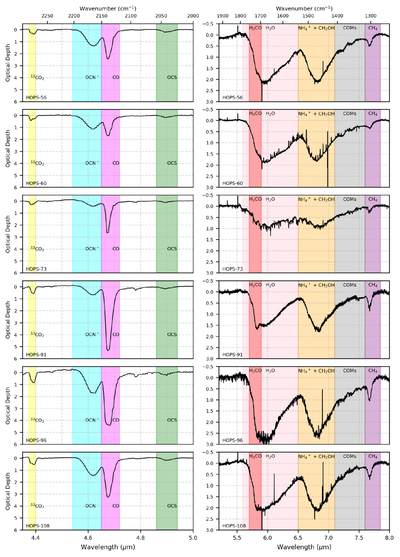
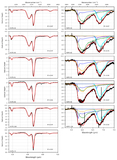
Caption: Figure 4.
Optical depth spectra toward the ALMA continuum intensity peak of the sources. The left column shows NIRspec spectra, and the right column shows MIRI MRS spectra. The colors indicate the absorption bands of various molecules.
Other Images in This Article
Show More
Copyright and Terms & Conditions
© 2026. The Author(s). Published by the American Astronomical Society.

Copyright ©
2026 Astronomy Image Explorer. All Rights Reserved.
