

Image Details
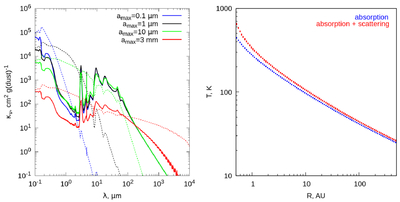
Caption: Figure 12.
Left: absorption and scattering coefficients calculated using the OPTOOL code for a number of grain dust distributions with different maximal grain sizes amax. Absorption and scattering coefficients are shown with solid and dashed curves, respectively. Right: temperature distributions calculated for the model where both absorption and scattering are accounted for (red line), and for the model with only absorption (blue).
Other Images in This Article
Show More
Copyright and Terms & Conditions
© 2026. The Author(s). Published by the American Astronomical Society.

Copyright ©
2026 Astronomy Image Explorer. All Rights Reserved.
