

Image Details
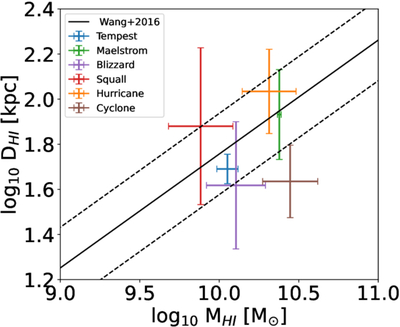
Caption: Figure 1.
Scaling relations for the six H I disks presented in this study. The points correspond to the mean values for a given system between z = 0 and z = 0.5, with bars showing the standard deviation. Top: the H I size–mass relation (A. H. Broeils & M. H. Rhee 1997a) for these systems. MHI is calculated as the total disk H I mass. DHI is twice the radius at which the mean column density drops below 1.25 × 1020 cm−2. The solid (dashed) line corresponds to the observational correlation (and 3σ scatter) found in J. Wang et al. (2016).
Other Images in This Article
Show More
Copyright and Terms & Conditions
© 2026. The Author(s). Published by the American Astronomical Society.

Copyright ©
2026 Astronomy Image Explorer. All Rights Reserved.
