

Image Details
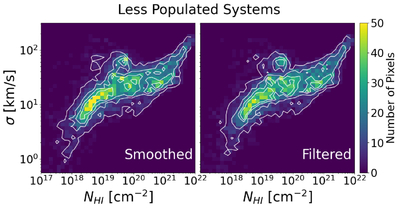
Caption: Figure 5.
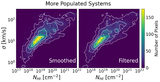
Log histogram of H I column density (NHI) versus velocity dispersion (σ) summed for the three less-populated systems (Tempest, Maelstrom, and Blizzard) at 20 Mpc. NHI was corrected for inclination (i) by a factor of ﹩\cos i﹩. The contours show the 25th, 50th, 75th, and 95th percentile curves. The synthetic survey parameters are analogous to the MHONGOOSE survey’s low-resolution case (beam FWHM ∼65”, sensitivity ∼1018 cm−2, minimum baseline =29 m). The plot on the left shows the distribution for the smoothed data cube (without filtering). There are two main peaks in the distribution: high column density and high velocity dispersion gas in the top right, and low column density and lower velocity dispersion gas in the bottom left. The plot on the right shows the same distribution for the filtered data cubes. The high column density peak is largely unaffected; however, the low column density peak is reduced by the filtering step. This implies that this gas is primarily diffuse and may not be visible to interferometric observations.
Other Images in This Article
Show More
Copyright and Terms & Conditions
© 2026. The Author(s). Published by the American Astronomical Society.

