

Image Details
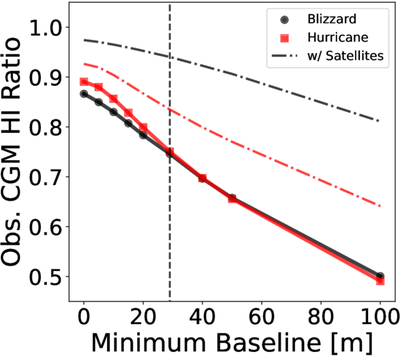
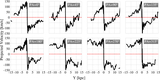
Caption: Figure 7.
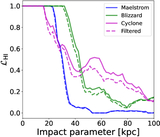
Evolution of how much H I emission in the CGM is observable as a function of the minimum baseline at 20 Mpc. The rest of the survey parameters are analogous to the MHONGOOSE survey’s low-resolution case (beam FWHM ∼ 65”, sensitivity ∼1018 cm−2). Solid lines show the CGM ratio with satellites removed, while the dashed–dotted lines show the ratio with satellites present. The vertical dashed line shows the MeerKAT minimum baseline (bmin = 29 m). With satellites removed, observing ∼90% of the CGM signal would require minimum baselines of a few meters, likely requiring single-dish data.
Other Images in This Article
Show More
Copyright and Terms & Conditions
© 2026. The Author(s). Published by the American Astronomical Society.

Copyright ©
2026 Astronomy Image Explorer. All Rights Reserved.
