Image Details
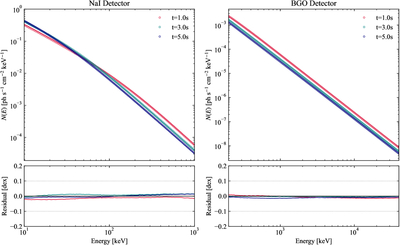
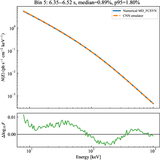
Caption: Figure 5.
Comparison between the CNN-emulated photon spectra and the corresponding numerical-model spectra on the fixed Fermi/GBM energy grids. The left and right columns show the NaI and BGO bands, respectively, for three representative epochs (t = 1.0, 3.0, and 5.0 s; colors). The upper panels present N(E) as a function of the energy, while the lower panels show the logarithmic residuals (in dex) between the emulator prediction and the numerical reference. Solid curves and open circles denote the numerical-model spectra and the CNN-emulated photon spectra, respectively.
Other Images in This Article
Copyright and Terms & Conditions
© 2026. The Author(s). Published by the American Astronomical Society.
Copyright ©
2026 Astronomy Image Explorer. All Rights Reserved.